Posts mit dem Label model werden angezeigt. Alle Posts anzeigen

Sonntag, 6. November 2016

Dip Day 792 in Detail

Calculation of Dip 792d with Star lifting

This post is the second part of the calculations to understand the shape of the dip at day 792 of Boyajian's star (KIC 8462852). For part one visit post: "Do we see Star lifting".

The Beam is Bent

The Dip day 792 is not symmetrical, therefore we have to introduce a beam, that is not perfect on a straight line from the center of the star. it is not difficult, to find reasons why the beam of the matter is bent in a direction. A simple reason is in Kepler dynamics during departure from the surface. 
As long as we don't understand the process in detail, I will again start with a simple model and try to fit the model with the data.
Figure 1 describes the new model of the beam. The beam starts at the surface of the star, and with height H it starts to have an optical density due to reduced temperature and therefore is no longer ionized.  

Fig 1: Properties of the physical model.

The beam is now modeled with small fractions of the length ds which are distorted against the direction angle depending on the distance l. At the end of the beam, the "smoke" comes to a rest and is distributed in this orbit by an exponential law, the density is maximal at the beam end and decays with distance in the bending direction.
For the simulation, the beam contains 105 elements. Each represents a beam length of 5 star radii, The first 5 star radii (first element in the simulation) are transparent due to the high temperature near the star surface.
Each simulated beam element has a transparency of 0,9984722. Each element is a little bit bent by
ap = -0,3971 day.
If an element is within the line of sight between Kepler and KIC 8462852, the resulting transparency is calculated by the multiplication of the transparency of every element.
At the end of the beam, the material enters an orbit, for some reason, and is accumulated. The optical density of the accumulated material decays by an exponential function d = d0 exp(a*w) thereby d0 = 0,001588, w = 3,30025 [1/day]. (The unit hour is used and could be converted in an angle if the distance and rotation period would be known). The value of the simulation was always averaged over 2.5h to adopt a little bit the shape of the unknown optical elements.
The result of this simple physical simulation is shown in fig 2:


Fig 2: Measured and simulated flux using the model
The model, containing only simple and plausible parameters fits within the limits of the Kepler data precision. The value of the free parameters, namely bending, optical density and the exponential function, were optimized manually.

I did not expect a result with such a low error.

There are some aspects not included in the simulation: an exact cross-section of the beam, surface flux of the star (it was assumed to be constant).

Other posts related to Tabbys Star

Dips part two
A simple model of Dip 792


Dienstag, 1. November 2016

Do we see Star lifting

The Try of an Explanation of the Dip at day 792

In the last time, there has been the suggestion, that the very strange dip around day 792 might be the signature of star lifting. A reasonable explanation of star lifting can be found at Wikipedia.

Fig 1: The dip at day 792 has a very interesting homogenous shape.

The basic Idea is, that a super civilization is able to harvest matter from the local star by magnetic or other means. This is quite difficult, due to the high temperature at the surface of the star. Therefore a beam of matter, similar to a natural solar solar flare has to be produced. I don't go into the technical details how or if this is possible, but I try to simulate the visible lightcurve of such an activity. 

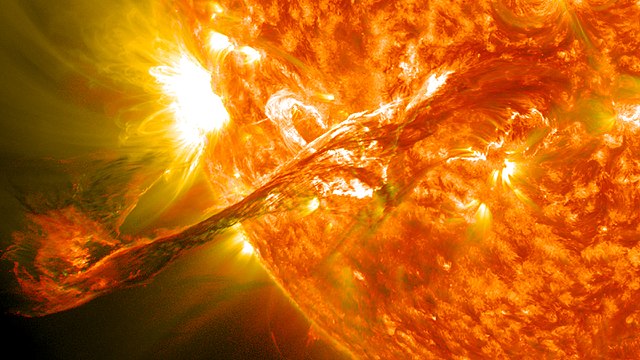
Fig 2: Natural solar flare at our Sun.

The most simple model

(A more complex model is described here "Dip 792 in Detail")
To generate the situation, we start with a very simple model. A long beam from the star points radially away from the center of the star. by accident, we are in the line of sight and see the beam crossing the star.
Fig 3: Simple model, a beam of matter, pointing away from the star.

To describe this model, we assume, that the beam is rotating around the star and a fraction of the beam absorbs the starlight on our line of sight.
The amount of dimming is then a function depending on geometric factors and the rotation angle as shown in fig 4 viewing the situation from the rotation axis of the system. 

Fig 4: Geometric situation, Kepler looks from the right side to the star with center C.

The star has a radius of r and the center is marked by C, a beam with an optical density d, at the surface of the star starts at point A and ends at point D. The dimming is proportional to the length, of the distance |AB|, because only this part of the beam covers our line of sight. We can calculate the distance CB, depending on the angle a, it is

|CB| = r/sine(a)

len(AB) = r/sine(a) - r  (1)

The angle a is depending on the time t, and the angular velocity w, by which the beam rotates around the star like a hand at a clock. 
It is convenient to set the time t to zero when a = 0. To suppress the infinite length of AB at a = 0, we have to take into account, that the beam is not infinite, but has the length AD. The equation (1) holds therefore only as long as the beam does not cross the sightline BE. This happens at the angle 

ac = arcsine( r / |CD| )

ac = arcsine( r / ( |AD| + r ))  (2)

The measured flux f(t) is then calculated, assuming f0 is the brightness of the star, by

f(t) = f0 - d ( r / sine( w t ) - r)   in the case {||wt|| > ac}

f(t) = f0 - d |AD|   in the case  {||wt|| < ac}   (3)

Let's have a look at our dip at day 792:

Fig 5: Very simple model of star lifting. (Sorry, for some reason this image is flipped in time)
Although we have used the most simple model, the left part of the graph is astonishingly similar to the measured dip. The parameters used for equation (3) are d = 0.16, f0 = 1, r = 1, w = 0,14 [1/30min].

An inhomogeneous absorbing beam

A further approximation to the real situation can start with the optical density of the beam. At the surface of the star, the beam has the same temperature as the solar surface and will not absorb any light. By leaving the surface the beam cools down and the atoms might absorb light by ionization. Again, I try a very simple model, the temperature is then depending from the visible surface of the sun, depending on the height. 
My geometric model is plotted in fig 6.
Fig 6: Temperature of the beam as a function of height |AB|

At the point B the beam has a height above the star of |AB|=h. The visible angle a is therefore given by the geometric relationships in the rectangular triangle BCD.

|AB| + r = |BC| 
and
sin(a)=r/|BC|

sin(a)=r/(|AB| + r)

a = arcsine(r/(h + r))   (4)

The visible cone P is, therefore, relative to the 2 pi surface situation

P = 2 pi sin(a) /2 pi

P = (r/(h+r))   (5)

A plot of this function is shown in fig 7.

Fig 7: Showing the surface of the star, a beam sees at a distance from the star

To keep things simple, we define a height, where the reionization happens. The function in fig 7 drops fast and the black body radiation is depending on the fourth power, so I guess with a height of two-star radii, the beam is reionized. 

To include this in our model, we replot a modified figure 4 in fig 8.

Fig 8: Modified beam with optical density starting at H
In the new model, the beam starts to have an optical density, starting at the point H and going up to D. Using this, we can replot the simple calculation from fig 5 again, only presenting the falling edge for better visibility:

Fig 9: The model matches the measured flux better in the first part.

Although the model is still very simple, the match between measured flux and model is now also in the first part good. Be aware, that the ionization doesn't happen instantly and has to be modeled by a more sophisticated model the basic effect of a certain threshold seems to exist. 
The steep side of the dip is not perfect, this may be due to the inhomogeneous radiation density of the star, another point that a better model should include.

In the next post, I will try to model the very steep rising edge by bending the beam. 

If anyone wants to support me with efficient computer models, he is invited please drop an email heindl(a)gmail.com

Other posts related to Tabbys Star

Dips part two
A more complex model of Dip 792