A deep dive into Dip 792 (part I)
The dip 792 of the most mysterious star in the galaxy has a very regular shape and is different from all other signals seen in the Kepler mission. (If new, find an introduction at Dips in Tabby's Star)
The second thing is the shape, it is definitely not the shape of a planet, as has been shown by Ksanfomality [2], The asymmetric structure does not match with a high eccentric planet due to timing and absorption. The same is true for comets, the density of a comet and the homogeneity of the dip is not something we expect to see by well-known comets analyzed in our solar system.
The third mystery is the obvious smoothness of the dip, this is only possible if a relatively simple shape or process is the cause of the dip. we should be very happy to have this dip 792 near the other much more complex and hard to understand dips later in the Kepler mission survey. If we understand D792, we might be able to take the hints to comprehend the other dips.
The fourth mystery is the total time of the dip, that is about 8 days. No massive object, even another star, would occlude this star for so long.
We can now synthesize the basic dip and the fading part. First look at the basic dip:
The basic dip has now a defined start and end, using the point of symmetry, 792.73d, and the value found for the end of the dip at 794.85d. We define this information:
 |
| The famous Dip of Day 792 at Boyajian Star (Data-Source: NASA Kepler Mission) |
What makes the Dip so unique?
The first thing is, this dip is very deep, about 15% of the light of the star is invisible to the telescope during the peak of the dip. This is a very high number, when we compare that to a transit of a Jupiter like planet, which would absorb about 1% of the starlight and when we remember, that Jupiter is near to the maximum size of a planet.The second thing is the shape, it is definitely not the shape of a planet, as has been shown by Ksanfomality [2], The asymmetric structure does not match with a high eccentric planet due to timing and absorption. The same is true for comets, the density of a comet and the homogeneity of the dip is not something we expect to see by well-known comets analyzed in our solar system.
The third mystery is the obvious smoothness of the dip, this is only possible if a relatively simple shape or process is the cause of the dip. we should be very happy to have this dip 792 near the other much more complex and hard to understand dips later in the Kepler mission survey. If we understand D792, we might be able to take the hints to comprehend the other dips.
The fourth mystery is the total time of the dip, that is about 8 days. No massive object, even another star, would occlude this star for so long.
Analysing the shape
In this post, I do not try to give a possible explanation of the shape as done before [3][4], but I look into the characteristics of the shape.
End and Start of the Dip
The first tricky thing is, to determine the length of the event. The end of the event seems to be easy to determine using a graphical extrapolation. If we look in a high-resolution plot of the data we find, that the dip ends at day 794.85. The uncertainty is within an hour or a few measurement points (0.5h).
The begin of the dip is much harder to define, due to the very smooth beginning of the dropping light intensity. It seems so, that the density of the absorbing object is fading away with no sharp border as seen in the high-resolution image, be aware of the slightly wider timescale.
We might get a better understanding of this shape when we assume an exponential decay as shown later in this post.
 |
| Dip 792 ends day 794,85 within a well-defined uncertainty of a few measurement points. |
The begin of the dip is much harder to define, due to the very smooth beginning of the dropping light intensity. It seems so, that the density of the absorbing object is fading away with no sharp border as seen in the high-resolution image, be aware of the slightly wider timescale.
 |
| Dip 792 starts with a very smooth slope of the signal at day 787. |
We might get a better understanding of this shape when we assume an exponential decay as shown later in this post.
Missing Datapoints
A look into the measured brightness at the recovering brightness at Day 792 shows a lot of missing data points. This is more an instrumental issue, but it should be mentioned. For further calculations, the missing data points were substituted by calculated values, using a linear interpolation of the value of the points before and after the gap.
 |
| Missing data points were calculated by linear interpolation using the two data points at the border of the gap. |
The steepness of the curve at the most dramatic part is 0.5%, that compares to a Jupiter sized object, that is leaving the solar disc within one hour.
Symmetric Dip?
The shape of the dip is not symmetric, but what, if we assume, there are two parts, one symmetric event (basic dip) and another part (fading part) which is adding to the symmetric part and resulting in the visible dip?
This calculation can be done if we assume, that the first part of the basic dip has the same shape as the second part. The second part is well known and the only thing is, to generate a mirror picture with a meaningful axis. To generate an easy to read mirror image, the missing data points during the measurement of Kepler were substituted by a linear interpolation of the available border points of the gap, in most cases, only one point was missing, resulting in a minor error.
The result is visible in the next plot, where both plots are visible. Blue is the original time series, red is the same graph, mirrored at the axis at the time point 792.73d.
 |
| The symmetric assumption of the dip 792. |
We can now synthesize the basic dip and the fading part. First look at the basic dip:
 |
| The basic dip is an artificially constructed dip using symmetric assumptions. |
Start of basic dip: t1 = 790.61d
Maximum: ts = 792.73d
End of basic dip: t2 = 794.85d
Duration: T = 4,24d
Further analysis of this shape might be interesting, but is not part of this post, maybe I will discuss this in another post.
The remaining Signal
Very interesting is now the question, what happens to the remaining signal. The remaining signal, calculated by subtracting the basic dip from the measured value, is shown in the next plot:
 |
| The remaining fading part, if we subtract the artificial basic dip from the measured data. |
The best way to see the exponential character is, to plot the data in a logarithmic scaling in the absorption axis.
To optimize the result, the data before day 791 are reduced in noise, by not subtracting the symmetric signal but by using a constant baseline with the value one. Otherwise, meaningless noise and fluctuations from the baseline beyond the basic dip would appear.
 |
| Log-plot of the absorption in the remaining signal after subtraction of basic dip. Different colors mark different slopes. |
Here comes the second part.
2017 May 19: We have a new dip, I publish this, and wait for new results.
Live: https://youtu.be/eYpIGZS8nJc
First new results:
What happens, if we assume, that the period of the dip 792 is 756 days?I have used this value for the start lifting model and have a quick view of the error of the right part:
 |
| The shape of star lifting with 756 day period as suggested by the new dip in 2017 |
Compare this plot with the old calculated period of 725 days:
 |
| The simulated shape using a period of 725 days |
The difference in the significant region, red marked, is very small. This may be a support for the star lifting hypothesis.
I plot this in my standard long time chart:
The result is, that the first full period arrives at day 792+756 = day 1548.
That is not a day with a significant dip.
Source: https://mobile.twitter.com/david_kipping/status/866318056947150848/photo/1
Periodic?
Is the new dip periodic? If we assume, that d792 is the start of some periodic process and today, 20 May 2017 is dip day, then 2268 are in between. If the dip series around d1500 is related, then a 756 day period makes sense.I plot this in my standard long time chart:
 |
| Compare 726 and 756 day period |
That is not a day with a significant dip.
First data of new dip
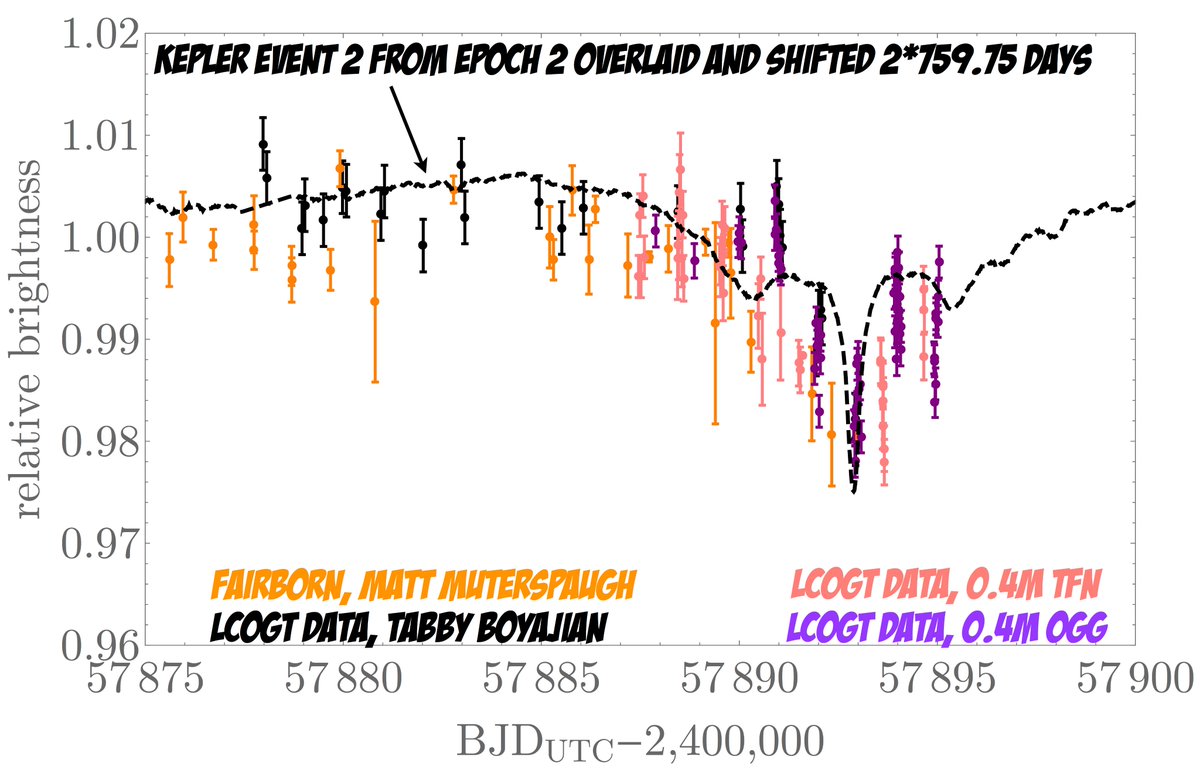 |
| Latest data of the first dip that was observed after the Kepler mission. (20 May 2017) |
Another data source, from Boyajian twitter account
The Dip is over
As Jason Wright mentions on Twitter, the dip seems to be over.
Data processing is now on.
It should be mentioned, that this is also a dip with an unclear beginning and a relatively sharp end, it might have some internal pattern, but this is very hard to conclude from the noisy data from earthbound telescopes.
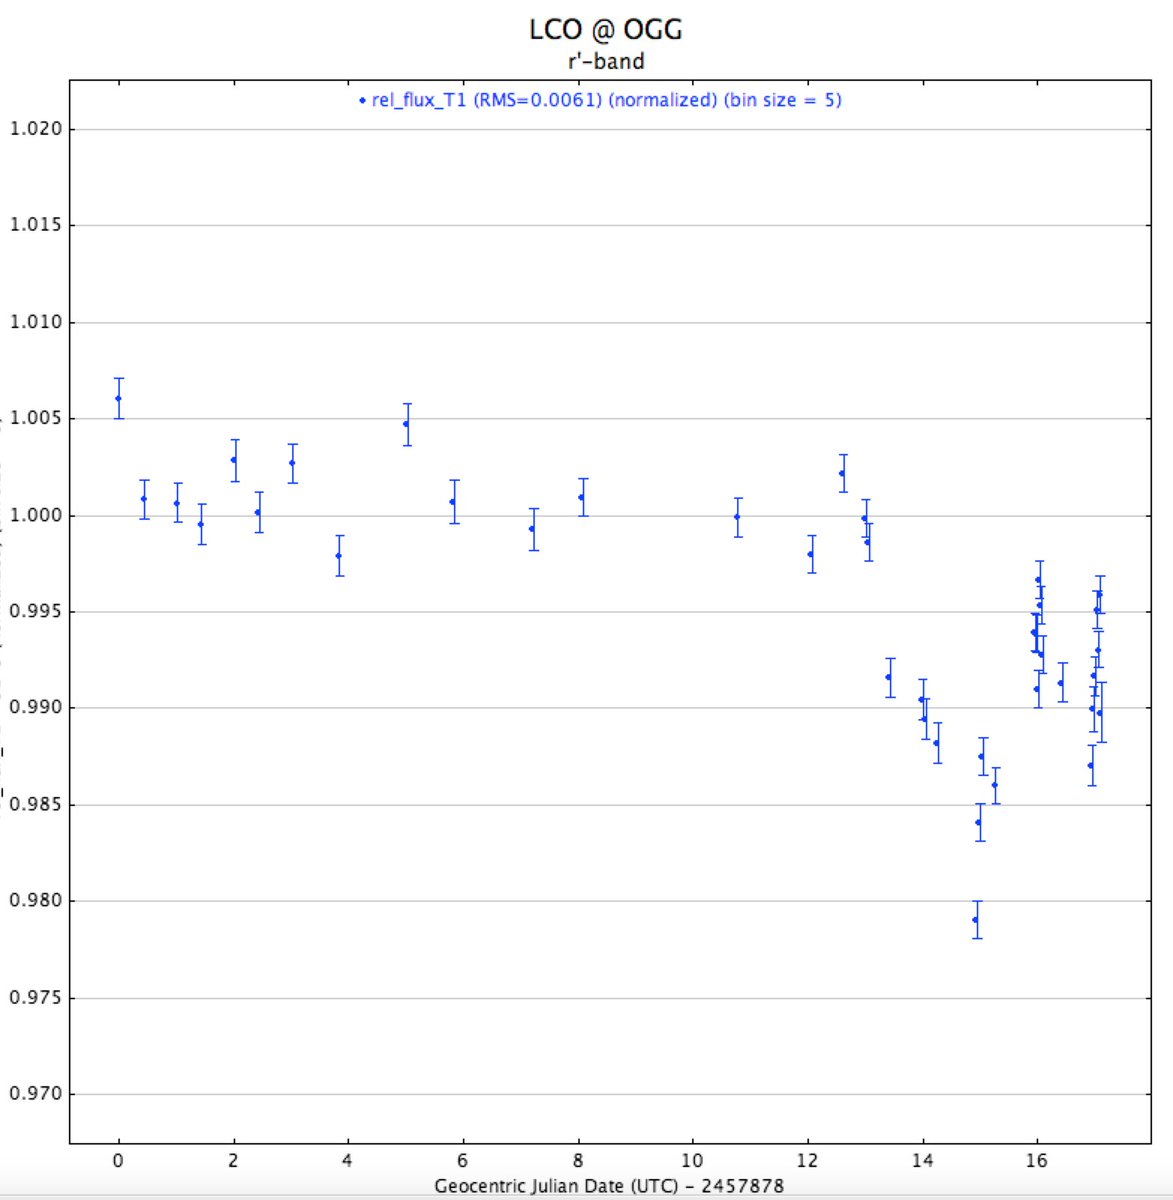 |
| More actual measured data, source: Boyajian. |
As Jason Wright mentions on Twitter, the dip seems to be over.
Data processing is now on.
 |
| The new dip has a duration of seven days, very typical for dips at this star. |
A new analysis of the results of the Mai 2017 dip is here!
Here comes the second part of the dip 792 analysis.
Here comes the second part of the dip 792 analysis.
References
[1] Nasa
[2] Ksanfomality, L.V. Astron. Rep. (2017) 61: 347. doi:10.1134/S1063772917040114
[3] Eduard Heindl, Do we see Starlifting?
[4] Eduard Heindl, A physically inspired model of Dip d792 and d1519 of the Kepler light curve seen at KIC8462852, 2016, https://arxiv.org/abs/1611.08368
[2] Ksanfomality, L.V. Astron. Rep. (2017) 61: 347. doi:10.1134/S1063772917040114
[3] Eduard Heindl, Do we see Starlifting?
[4] Eduard Heindl, A physically inspired model of Dip d792 and d1519 of the Kepler light curve seen at KIC8462852, 2016, https://arxiv.org/abs/1611.08368
Keine Kommentare:
Kommentar veröffentlichen